

Everything You Are Being Told About Saving & Investing Is Wrong – Part 2
Source: Real Investment Advice
It is always interesting reading article comments as they are generally full of excuses why saving money and building wealth can’t be done. The general thesis is that as long as you have social security (which is threatening payout cuts over the next decade) and/or a pension (which only applies to 15% of the country currently,) then you don’t need to save as much.
Personally, I don’t want my retirement based on things which are 1) underfunded 2) subject to government-mandated changes, and 3) out of my control. In other words, when planning for an uncertain future, it is always optimal to hope for the best but plan for the worst.
However, the premise of the article was to clear up the disconnect between the cost of living today and 30-years into the future, as well as the amount of money needed to be financially independent for the entire lifespan after retirement.
Yes, we can all get by on less, in theory. But an examination of retirement savings statistics and the cost of healthcare in retirement (primarily due to poor healthcare habits earlier in life) doesn’t necessarily support those comments that saving less and being primarily dependent on Social Security is optimal.
The Investing Problem
While “Part One” focused on the amount of savings required to sustain whatever level of lifestyle you choose in the future, we also need to discuss the issue of the investing side of the equation.
Let’s start with a comment made on Part-One of this series:
“If you want to play it safe just buy a no-load, low fee, index fund and index into it regularly. Pay yourself first. Let the power of compounding do its magic.”
See, it’s so easy. Just buy an index fund, dollar cost average into it, and “bingo,” you have got it made.
Okay, I’ll bite.
If that is the case, then why this?
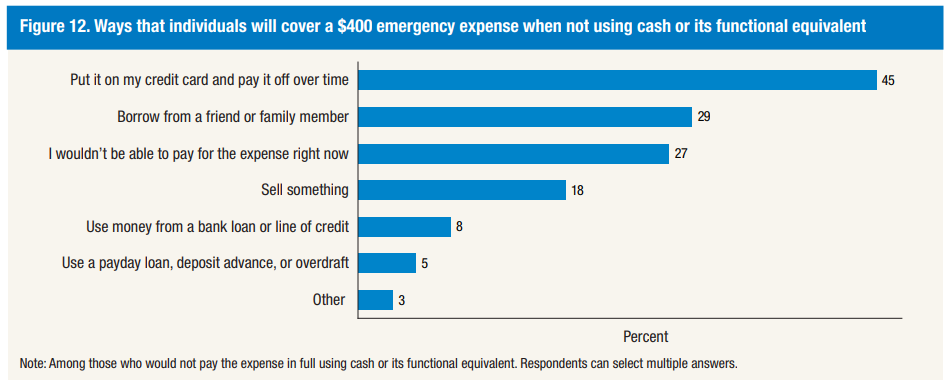
“More than half of Americans who were adults amid the Great Recession said they endured some type of negative financial impact, Bankrate found. And half of those people say they’re doing worse now than before the crisis.”
“According to a brand new survey from Bankrate.com, just 37% of Americans have enough savings to pay for a $500 or $1,000 emergency. The other 63% would have to resort to measures like cutting back spending in other areas (23%), charging to a credit card (15%) or borrowing funds from friends and family (15%) in order to meet the cost of the unexpected event.”
As I stated in the previous article, I am all for any program and process which encourages people to save and invest for their retirement. My hope is that we can clear up some of the “misconceptions” to improve the chances that retirement years are not spent collecting food stamps and shopping at the local “Goodwill” store,
Let’s start by clearing up the numerous erroneous comments on the previous article with respect to returns and investing.
Compound & Average Are Not The Same Thing
” Markets have returned roughly 10% per year of compounded growth, INCLUDING the down years.”
What the commenter is confused about is, as stated previously, that markets have variable rates of returns. Historically, over the last 120 years, the market has AVERAGED roughly 10% annually. (6% from capital appreciation which is equivalent to the long-term economic growth rate, and 4% from dividends. Today, economic growth is averaging 2%ish since 2000 and dividends are 2% so do the math for future return expectations. 2+2=4%. (Since 2000, average growth has been just a bit more than 5% and the next bear market will roll that average back to 4%)
The chart below shows the difference in nominal values of $1000 invested on an actual basis versus a compounded rate of return of 6% (For the example we are using capital appreciation only.)
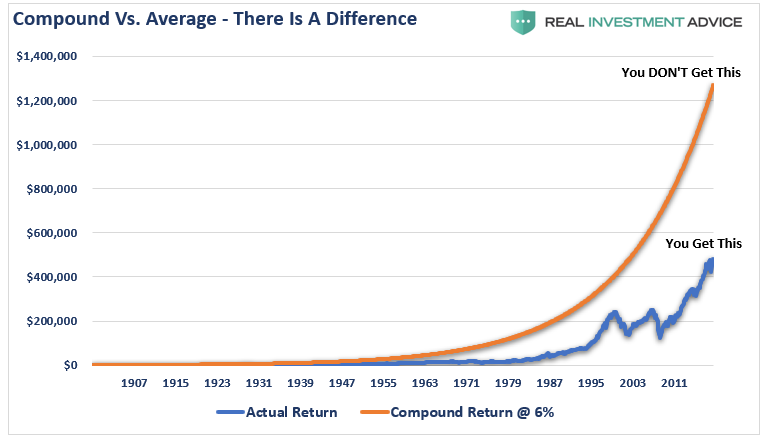
Mathematically, both of those lines equate to a 6% return.
The top line is what investors THINK they will get (compound returns.) The bottom line is what they ACTUALLY get
The difference is when losses applied to invested dollars. The periods of time spent making up previous losses is not the same as growing money. (Bonds, which mature at face value and have a fixed coupon, have had the same return as stocks since the turn of the century.)
This “math problem” is the reason there is a pension fund crisis in the U.S. The massively underfunded pension system was caused by depending on 7%-annual returns in order to reduce saving rates.
Variable Rates Of Return Change The Game
In Part 1, we laid out a simple example of various current incomes adjusted for inflation 30-years into the future. I am presenting the chart again so the subsequent charts have context.
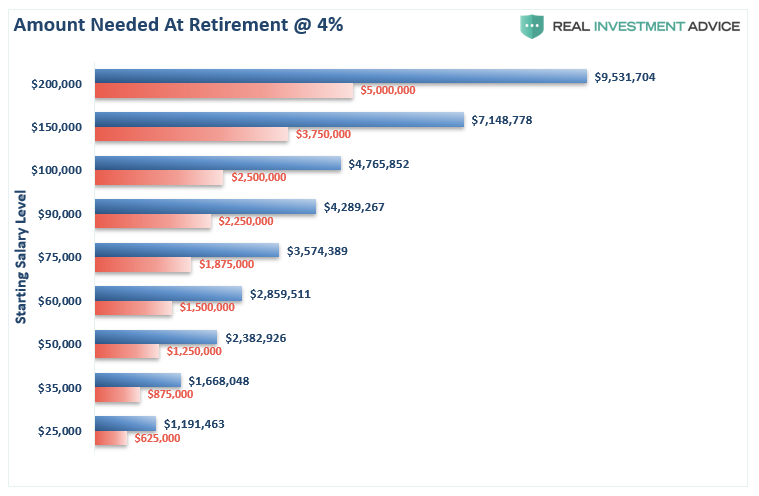
Now, let’s look at the impact of variable rates of returns on outcomes.
Let’s assume someone starts a super aggressive program of saving 50% of their income annually in 1988. (This was at the beginning of one of the greatest bull market booms in history giving them every advantage of front loaded returns and they get the benefit of the last 10-year long bull market.) Since our young saver has to have a job from which to earn income to save and invest, we assume he begins his journey at the age of 25.
The chart below starts with an initial investment of 50% of the various income levels shown above with 50% annual savings into the S&P 500 index. The entire portfolio is on a total return basis and adjusted for inflation.
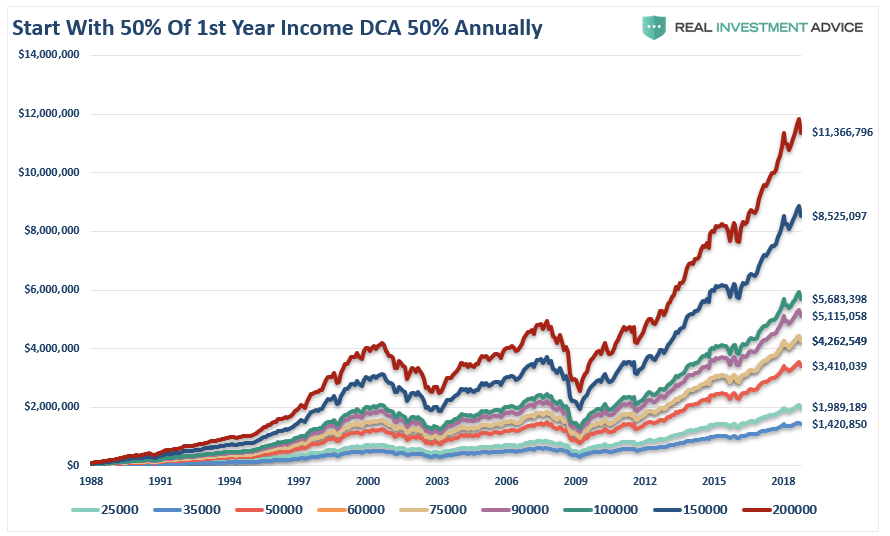
Wow, they certainly saved a lot of money, and they met the amount need to completely replace their inflation-adjusted living standards for the rest of their lives.
Unfortunately, our young saver didn’t actually retire all that early.
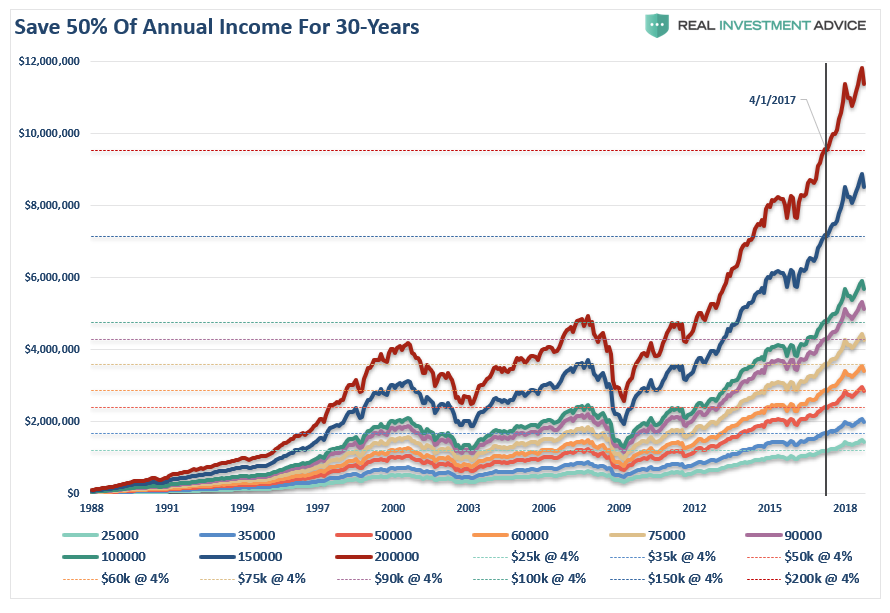
Despite the idea that by saving 50% of one’s income and dollar-cost averaging into index funds, it still took until April of 2017 to reach the retirement goal. Yes, our your saver did retire early at the age of 54, and it only took 29-years of saving and investing 50% of their salary to get there.
Given the realities of simply maintaining a rising standard of living, the ability for many to save 50% of their income is likely unrealistic. If it wasn’t then we would not have statistics like this:
Instead, the next chart shows the same data but starting with 10% of our young saver’s income and adding 10% annually. (Which is the “Magic Number” for success)
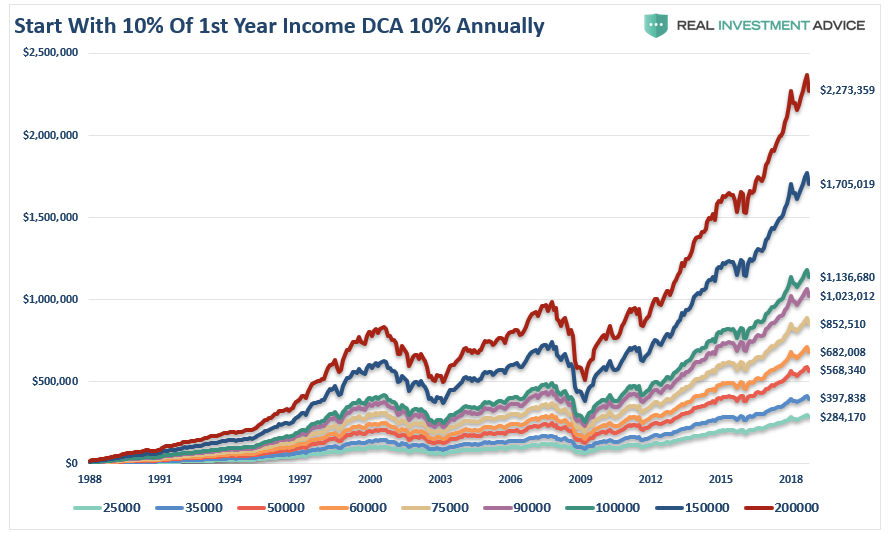
Okay, it’s not so “Magic.”
There are two important things to note in the charts above.
The first is that saving 10% annually leaves individuals far short of their retirement needs. The second is that despite two massive bull market advances, it was the last 13-year period from 2000 to 2013 which left individuals far short of their retirement goals.
What the majority of investors misunderstand when throwing around numbers like 6% average returns, 10% compound returns, etc., is that losses matter, and they matter a lot.
Here are the TWO most important lessons:
- Getting back to even is not the same as making money.
- The time lost in reaching your financial goals can not be recovered.
It should be relatively obvious the last decade of a massive, liquidity driven advance will eventually suffer much the same fate as every other massive bull market advance in history. This isn’t a message of “doom,” but rather the simple reality that every bull market advance must be followed by a reversion to remove the excesses built up during the previous cycle.
The chart below tells a simple story. When valuations are elevated (red), forward returns have been low and market corrections have been exceptionally deep. When valuations are cheap (green), investors have been handsomely rewarded for taking on investment risk.

With valuations currently on par with those on the eve of the Great Depression and only bettered by the late 1990’s tech boom, it should not be surprising that many are ringing alarm bells about potentially low rates of return in the future. It is not just CAPE, but a host of other measures including price/sales, Tobin’s Q, and Equity-Q are sending the same message.
The problem with fundamental measures, as shown with CAPE, is that they can remain elevated for years before a correction, or a “mean reverting” event, occurs. It is during these long periods where valuation indicators “appear” to be “wrong” that investors dismiss them and chase market returns instead.
Such has always, without exception, had an unhappy ending.
Things You Can Do To Succeed
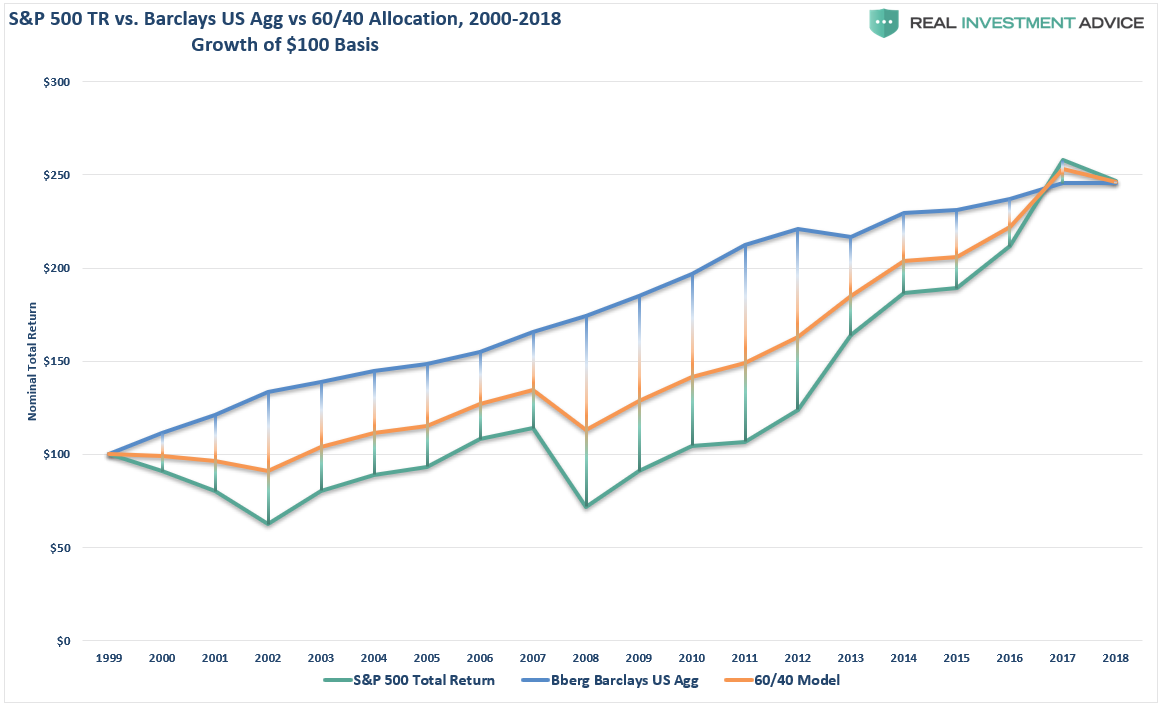
There are many ways to approach managing portfolio risk and avoiding more major “mean reverting”events. While we don’t recommend or suggest that you try to “time the market” by being “all in” or “all out,” it is critical to avoid major market losses during the accumulation phase. As an example, the chart below shows how using a simple 12-month moving average to avoid major drawdowns can impact long-term returns. We used the same 10% savings rate as above, dollar cost averaged into an S&P 500 index on a monthly basis, and moved to cash when the 12-month moving average is breached.
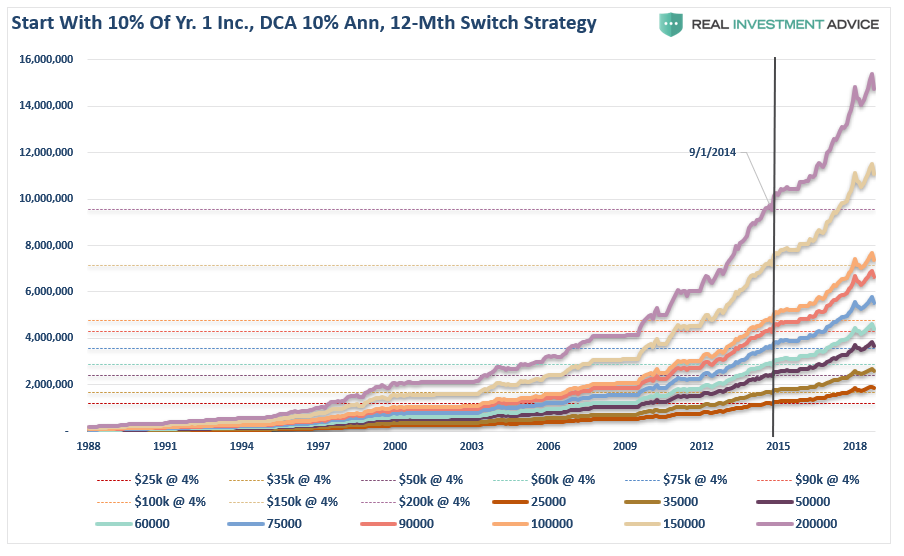
By avoiding the drawdowns, our young saver not only succeeded in reaching their goals but did so 31-months sooner than our example of saving 50% annually. It doesn’t matter what methodology you use to minimize risk, the end result will be same if you can successfully navigate the full-cycles of the market.
You Can Do This
Last week, we laid out some suggestions on what you can do to build savings. This week will add the suggestions for the investing side of the equation.
- It’s all about “cash flow.” – you can’t save if you don’t have positive cash flow.
- Budget – it’s a four-letter word for most Americans, but you can’t have positive cash flow without it.
- Get off social media – one of the biggest impacts to over spending is “social media” and “keeping up with the Jones’.” If advertisers were getting your money from social media they wouldn’t advertise there.
- Get out of debt and stay that way. No, you do not need a credit card to build credit.
- If you can’t pay cash for it, you can’t afford it. Do I really need to explain that?
- Expectations for future returns should be downwardly adjusted. (You aren’t going to make 6% annually)
- The potential for front-loaded returns going forward is unlikely.
- Control investment behaviors and emotions that detract from portfolio returns is critical.
- Future inflation expectations must be carefully considered.
- Account for “variable rates of returns” in your plan rather than “average” or “compound.”
- Understand risk and control drawdowns in portfolios during market declines.
- Save money regularly, invest when reward outweighs the risk. Cash is always an alternative.
Lastly, remember that “time” is your most valuable commodity and is the only thing we can’t get more of.